This website is managed by Ultima Markets’ international entities, and it’s important to emphasise that they are not subject to regulation by the FCA in the UK. Therefore, you must understand that you will not have the FCA’s protection when investing through this website – for example:
You will not be guaranteed Negative Balance Protection
You will not be protected by FCA’s leverage restrictions
You will not have the right to settle disputes via the Financial Ombudsman Service (FOS)
You will not be protected by Financial Services Compensation Scheme (FSCS)
Any monies deposited will not be afforded the protection required under the FCA Client Assets Sourcebook. The level of protection for your funds will be determined by the regulations of the relevant local regulator.
Note: UK clients are kindly invited to visit https://www.ultima-markets.co.uk/. Ultima Markets UK expects to begin onboarding UK clients in accordance with FCA regulatory requirements in 2026.
If you would like to proceed and visit this website, you acknowledge and confirm the following:
1.The website is owned by Ultima Markets’ international entities and not by Ultima Markets UK Ltd, which is regulated by the FCA.
2.Ultima Markets Limited, or any of the Ultima Markets international entities, are neither based in the UK nor licensed by the FCA.
3.You are accessing the website at your own initiative and have not been solicited by Ultima Markets Limited in any way.
4.Investing through this website does not grant you the protections provided by the FCA.
5.Should you choose to invest through this website or with any of the international Ultima Markets entities, you will be subject to the rules and regulations of the relevant international regulatory authorities, not the FCA.
Ultima Markets wants to make it clear that we are duly licensed and authorised to offer the services and financial derivative products listed on our website. Individuals accessing this website and registering a trading account do so entirely of their own volition and without prior solicitation.
By confirming your decision to proceed with entering the website, you hereby affirm that this decision was solely initiated by you, and no solicitation has been made by any Ultima Markets entity.
Learn how the Sharpe ratio measures risk‑adjusted returns. Analyse why the sharp ratio matters and how investors use it to compare strategies effectively.
Understanding the Sharpe ratio is essential for investors who want to measure returns in relation to risk. Frequently misspelt as the sharp ratio, this metric allows traders and portfolio managers to see how much return they receive for every unit of risk taken.
In modern markets, where volatility varies across asset classes, the Sharpe ratio remains one of the most widely used measures of risk‑adjusted performance. This article explains how it works, how to interpret it, its limitations, and how it compares with alternative metrics.
What Is the Sharpe Ratio
The Sharpe ratio was developed by Nobel laureate William F. Sharpe in the 1960s to improve how investors evaluate returns relative to risk.
Rather than focusing solely on how much an asset earned, the Sharpe ratio accounts for the volatility of that return. In other words, high returns are not always better if they come with significant fluctuations.
The sharp ratio is simply an alternate spelling used informally, but the underlying principle is identical.
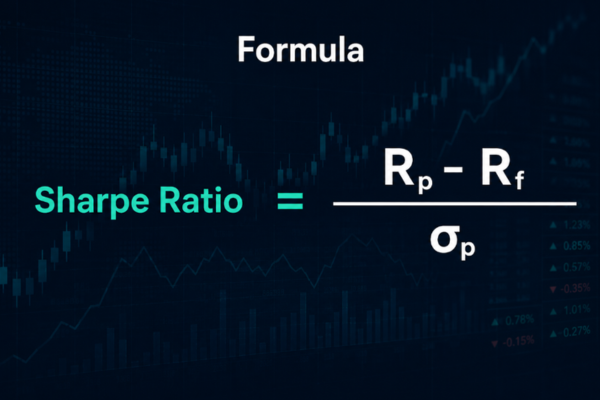
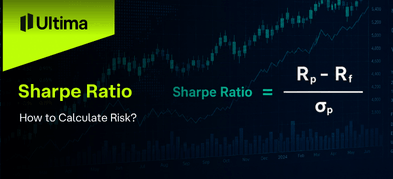
How the Sharpe Ratio Is Calculated
The formula for the Sharpe ratio is:
Sharpe Ratio= (Rp−Rf)/σp
Where:
Rp = Portfolio return
Rf = Risk‑free rate (often government bonds)
σp = Standard deviation of portfolio returns
This calculation produces a single number that reflects risk‑adjusted performance. A higher value indicates more return for each unit of risk.
Example
Suppose a portfolio returned 14% while the risk-free rate was 3% and volatility was 8%:
(14%-3%)/8% = 1.375
This indicates a risk‑adjusted return of 1.375. Comparing it with another portfolio with a Sharpe ratio of 1.8 shows the second strategy delivered better returns relative to risk.
Interpreting the Sharpe Ratio
A higher Sharpe ratio generally indicates better risk‑adjusted performance:
Above 1 → Good
Above 2 → Very good
Above 3 → Excellent
Below 1 → Risk may outweigh return
Modern Benchmarks:
Asset Type
Typical Sharpe Ratio
Notes
S&P 500
~1.1
Equity index, moderate volatility
Crypto Quant Funds
~1.5
Higher risk, higher return
Hedge Funds
1.2 – 1.8
Strategy dependent
It is most effective when comparing similar types of investments, as volatility profiles can vary widely across markets.
Why the Sharpe Ratio Matters
Investors rely on the Sharpe ratio for three key reasons:
1. Risk‑Adjusted Comparison
It allows evaluation of whether higher returns actually compensate for higher risk.
2. Portfolio Optimisation
By including risk in performance assessment, the ratio aids in building more balanced portfolios.
3. Strategy Evaluation
Traders can compare different strategies to determine which delivers higher returns per unit of risk.
Common Misconceptions and Limitations
Despite its popularity, the Sharpe ratio has several limitations:
Upside vs Downside Volatility
All volatility is treated equally. Positive deviations contribute the same as negative ones, even though investors generally welcome gains. The Sortino ratio addresses this by focusing on downside risk.
Assumes Normal Distribution
Financial returns often exhibit fat tails and skewness, meaning the Sharpe ratio may misrepresent risk for assets like cryptocurrencies or emerging markets.
Sensitivity to Time Frame
Short-term volatility can distort the ratio. Analysts should assess multiple time periods for a more robust view.
Risk-Free Rate Impact
Changes in the benchmark risk-free rate (e.g., Treasury yields) affect excess return calculations. Higher rates reduce the Sharpe ratio even if nominal returns remain constant.
Alternatives to the Sharpe Ratio
Metric
Focus
Strength
Sortino Ratio
Downside risk
Penalises only negative volatility
Calmar Ratio
Return vs max drawdown
Highlights potential capital erosion
Treynor Ratio
Systematic risk
Measures return per unit of market risk (beta)
Investors often use these metrics alongside the Sharpe ratio to gain a more complete picture.
Conclusion
The Sharpe ratio remains a cornerstone of investment analysis because it links return to risk.
While sometimes referred to as the sharp ratio, the concept is consistent. Investors should consider its limitations and complement it with other metrics like Sortino or Calmar ratios. When used effectively, the Sharpe ratio enables more informed decisions and clearer comparisons between strategies and portfolios.
FAQs
What is a good Sharpe ratio?
Above 1 is generally good; above 2 is very good. It varies by asset type.
Can the Sharpe ratio be negative?
Yes, indicating the investment underperformed the risk-free rate on a risk-adjusted basis.
Is the sharp ratio the same as the Sharpe ratio?
Yes. The spelling “sharp ratio” is a common variant, but it refers to the same metric.
Share Now
Disclaimer:This content is provided for informational purposes only and does not constitute, and should not be construed as, financial, investment, or other professional advice. No statement or opinion contained herein should be considered a recommendation by Ultima Markets or the author regarding any specific investment product, strategy, or transaction. Readers are advised not to rely solely on this material when making investment decisions and should seek independent advice where appropriate.
Thank you for visiting the Ultima Markets website. Please note that this website is intended for individuals residing in jurisdictions where access is permitted by law. Ultima and its affiliated entities do not operate in your home jurisdiction.
By clicking ‘Acknowledge’, you confirm that you are entering this website solely on your own initiative and not as a result of any specific marketing outreach. You wish to obtain information from this website based on reverse solicitation principles, in accordance with the applicable laws of your home jurisdiction.