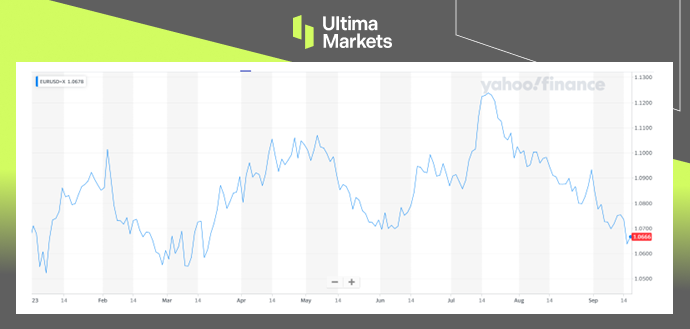
For investors investing in China’s A-shares, the performance of China’s stock market so far this year has only been slightly impressive at the beginning of the year. However, as China’s economic recovery gradually falls short of expectations, and the exchange rate of CNY/USD continues to fall, the performance of A-shares has also declined. Although there are frequent rumors in the market that China will launch large-scale stimulus, it turns out there is always loud thunder but little rain.
On August 27, the China Securities Regulatory Commission finally introduced a series of favorable policies such as halving stamp. However, at the opening of the next day, the three major A-share stock indexes only rose for a short period of about 1 minute, then fell back one after another. As a result, many Chinese netizens commented: “I’m optimistic about the fate of the country but choose to bet on the Nasdaq.”
In today’s turbulent international political and economic situation, can China’s A-shares break out of the siege and turn the tide? This article will take you to find out.
Why the large stimulus isn’t coming?
In addition to the need to wait for the RMB exchange rate to strengthen, whether China can introduce large-scale stimulus measures is also an important factor in the strength of the A-shares market. However, it seems that China is quite conservative about the introduction of stimulus measures. Not only is the intensity of the stimulus measures currently introduced not large, but the speed of introduction is as fast as squeezing out toothpaste, and China has not shown that it plans to launch large-scale stimulus.
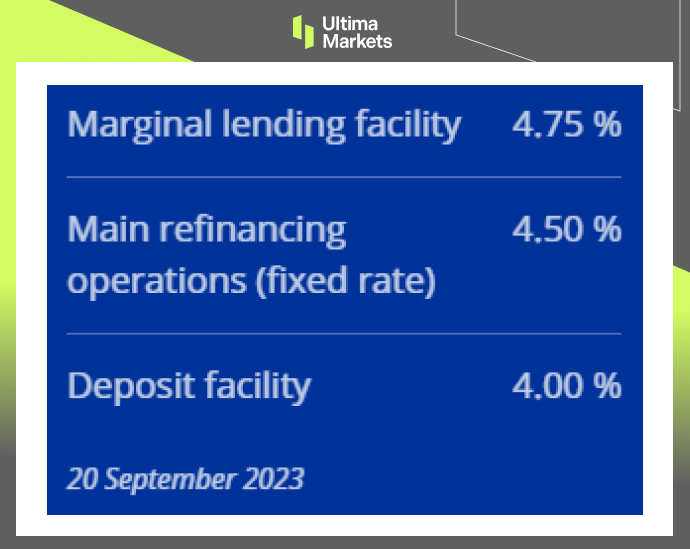
On September 15, the People’s Bank of China decided to lower the deposit reserve ratio of financial institutions by 0.25 percentage points for the second time this year. Although it lowered the required reserve ratio, it did not lower interest rates. Therefore, the market reaction was also calm. In the end, the Shanghai Composite Index even closed down 0.28% that day. It can be seen that the so-called rescue efforts obviously did not meet market expectations.
So here comes the question. Since the market now knows that large-scale stimulus will likely solve the current predicament of A-shares, why is there still no such stimulus?
Just in mid-August, Ray Dalio, the founder of Bridgewater Associates, the world’s largest hedge fund, publicly stated that China is in urgent need of reducing leverage. His remarks may explain why China has been slow to introduce large stimulus policies. As we all know, debt is a double-edged sword. When maintained at the right level, it can provide upward momentum for national economic growth. However, once the critical threshold is exceeded, debt will undoubtedly have a negative impact on the economy.
In fact, as early as a few years ago, China had begun to continuously publicize that it would embark on a “road to deleveraging.” In 2018, China’s macro leverage ratio was about 240%. However, in recent years, with the outbreak of the epidemic and changes in the economic situation, the leverage ratio has not only not declined, but has risen to about 280%. Therefore, although large-scale stimulus policies are almost the only prescription to boost China’s stock market in the short term, China will obviously remain cautious about stimulus policies under the urgent need to reduce leverage.
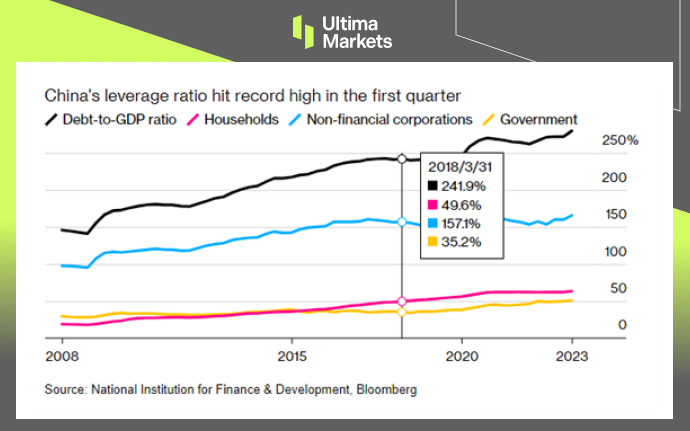
China’s leverage ratio has remained high for several years.
Can A-shares get better in the future?
Since it is difficult to implement stimulus measures on a large scale at the moment, does this mean that A-shares are hopeless? Whenever this happens, you will definitely hear some so-called stock commentators say: “Although A-shares are under pressure in the short term, their long-term fundamentals are good.” In our opinion, such similar remarks are probably just half true. Although A-shares are under pressure in the short term, their long-term fundamentals may not be completely positive.
Why? To answer this question, we must start with the composition of A-shares.
If we talk about the market capitalization leaders or star stocks in A-shares, investors may first think of consumer or financial banking stocks such as Kweichow Moutai, Ping An, and Industrial and Commercial Bank of China. Correspondingly, when talking about the leading stars of the US stock market, Apple, Tesla, Nvidia, Amazon, etc. may come to mind, but these companies basically belong to the technology industry.
In fact, this stereotype aligns with the current status of the A-share and US stock markets. Let’s take the FTSE China A50 Index (composed of the top 50 A-share stocks by market capitalization) as an example. The figure below shows that among the top 50 stocks by market capitalization, the financial industry accounts for 28.25%, and the core consumer industry accounts for 30.77%. These two major industries undoubtedly occupy the majority.
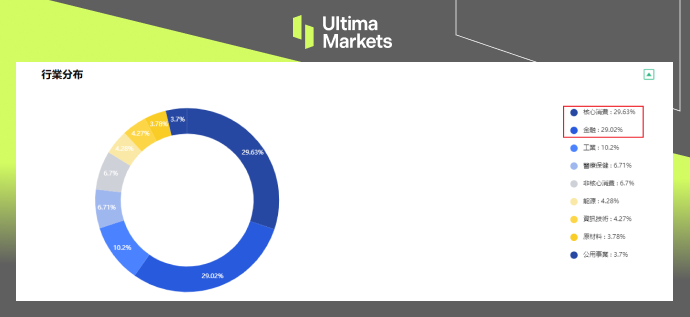
Breakdown of industries in FTSE A50 Index
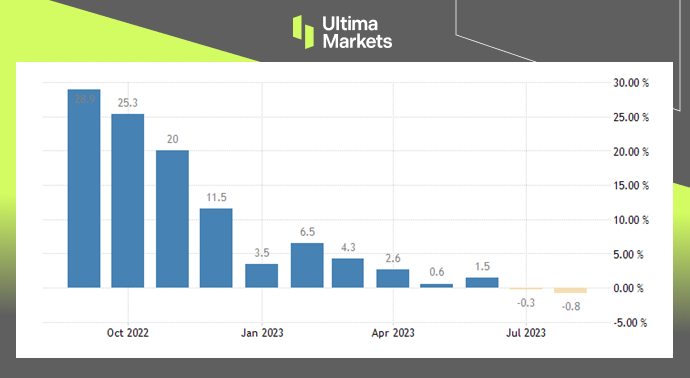
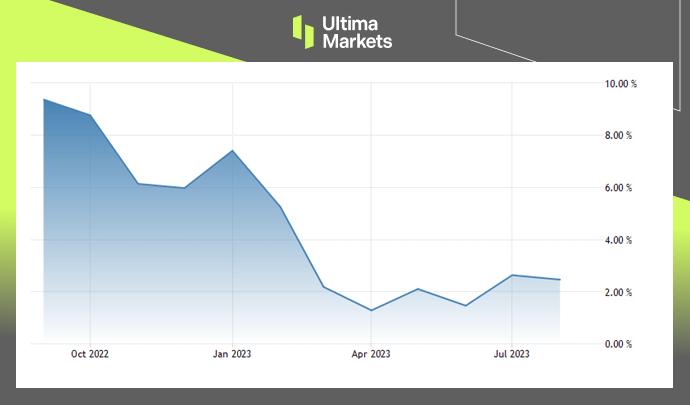
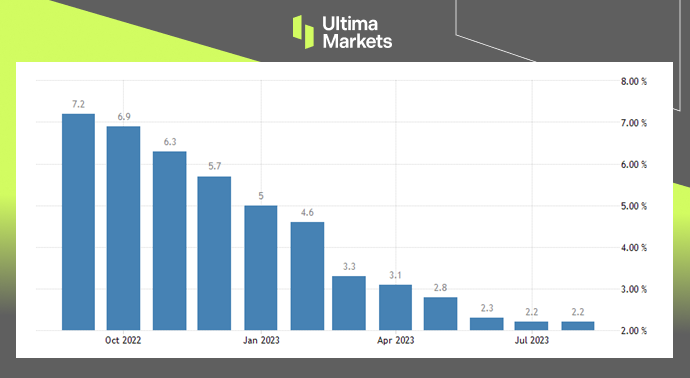
But the problem lies precisely with these two industries. The first is the consumer industry. Since China has continued to show a “consumption downturn” this year, the consumer industry will naturally bear the brunt of the impact. This can also be reflected in the rise and fall of CPI (Consumer Price Index). As can be seen from the chart below, since entering 2023, China’s CPI trend, if not a recessionary trend, has at least shown a sideways trend. And this is naturally not good news for the core consumer industry. Consumption needs a trend toward inflation to realize that consumer prices can rise, allowing relevant companies to reap higher profits. But once the consumption level falls into a sideways situation, the relevant company’s growth expectations will naturally be greatly restricted.

Rise and fall of China’s CPI in the past year.
Then, let’s talk about the financial industry. Financial stocks in China’s A-share market are actually mainly banking stocks such as China Merchants Bank, Industrial and Commercial Bank of China, and Agricultural Bank of China. In the current economic environment in China, the growth expectations of bank stocks are subject to a key factor, which is net interest margin. The so-called net interest margin refers to the ratio of the bank’s net interest income to the bank’s total interest-earning assets. To put it simply, the net interest margin is equivalent to the profit margin of the banking industry. The higher the net interest margin, the higher the bank’s profitability and vice versa.
The chart below shows the net interest margin trend of China’s banking industry since 2011. As can be seen from the figure, the net interest margin of China’s banking industry has shown a clear downward trend in the past 10 years. And this is naturally not a good thing for banks that rely on net interest margins to make profits.
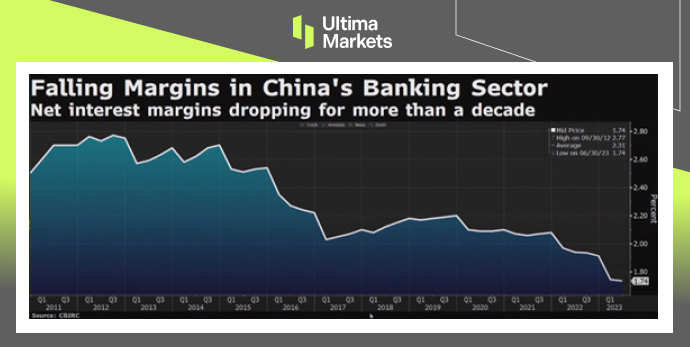
Trend of net interest margin of China’s banking industry since 2011.
All in all, the current market structure of A-shares is basically dominated by the consumer industry and the financial and banking industries, and such a market structure is unable to support a higher market value. If A-shares really want to rival U.S. stocks in the future and achieve a long-term bull market, they will inevitably need to let their leading market value companies gradually shift to high-value-added industries such as the technology industry or the medical industry. Only by allowing these industries to take a dominant position can A-shares truly achieve “good long-term fundamentals.”

Breakdown of industries of shares in S&P 500 Index
When the A-shares markets can rebound?
So can A-shares make those high-value-added technology industries the market capitalization leaders in the future? Combined with the continuous technological blockade imposed by the United States and other Western countries on China in recent years, it seems that there is little hope of achieving this goal. But what is surprising is that Huawei, which has been subject to US technology sanctions for four years, suddenly released the latest Mate 60 series mobile phones in a low-key manner without any publicity and promotion. Confirmed by Bloomberg News, its SoC adopts the 7nm process and is manufactured by SMIC. For China’s technology industry, this is undoubtedly the first glimmer of light after a long dark night. The blue line in the figure below represents the trend of SMIC share price in the Hong Kong stock market in the past month, while the orange line represents the trend of the Shanghai Composite Index during the same period.
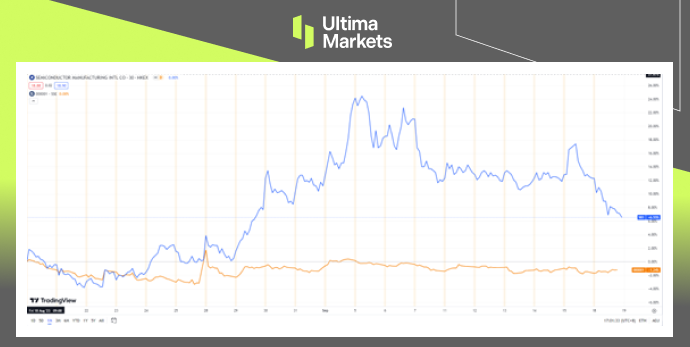
The comparison of SMIC and Shanghai Composite Index in the past month
As we all know, China’s rapid economic development in the past two decades began with the real estate economy led by land finance. In combination with the foreign trade export industry, which was originally labor-intensive, it also created jobs for the city, thereby promoting urbanization development. However, as the international economic situation has become more turbulent in recent years, the demand for imported goods from China to developed countries such as Europe and the United States has continued to decline. The export-oriented export industries in the past have been hit first, which in turn has reduced urban employment, thus further accelerating the growth of China’s real estate industry.
Therefore, given China’s current economic situation, continuing to follow the old path of land finance or mid- to low-end foreign trade exports is definitely not a long-term option. If China wants to reverse its current sluggish economy and A-share dilemma, industrial upgrading is the only way. Because in the macro division of labor in the international industrial chain, using the so-called cheap demographic dividend to develop foreign trade OEM production is inherently the lowest-profit link. Only by occupying high-end links such as R&D and design and changing China’s current position in the international industrial chain can it bring more income to the overall economy and individual consumers. Only when incomes begin to truly increase and people’s expectations for the future improve, will China’s economy and the A-share market truly improve.
Summary
- The Chinese market needs large-scale stimulus in the short term, but the large stimulus will not be conducive to long-term development. Therefore, the current stimulus measures introduced by China are relatively restrained, and the actual intensity is not particularly large.
- Since the current industry structure of the A-share market is mainly focused on finance banking or consumption, and lacks high-value-added industries, it is impossible to essentially improve the long-term market conditions of A-shares.
- Only by accelerating industrial upgrading can fundamentals of A-shares market truly improve in the future.
Disclaimer
The comments, news, research, analyses, prices, and all information contained in this article can only be regarded as general information and are provided only to help readers understand the market situation and do not constitute investment advice. Ultima Markets has taken reasonable steps to provide up-to-date information, but cannot guarantee the accuracy and may modify without notice. Ultima Markets will not be responsible for any loss incurred due to the application of the information provided.