Comprehensive Brent Oil Analysis for October 3, 2023
In this comprehensive analysis, Ultima Markets brings you an insightful breakdown of the Brent Oil (UKOUSD) for 3rd October 2023.
Key Takeaways
Key Point: The lifting of the U.S. government shutdown crisis, coupled with robust PMI data, has driven the U.S. dollar index to 107, a level not seen since November last year. This surge in the dollar’s strength has led to a sharp decline in non-U.S. currencies and a corresponding dip in crude oil prices, reaching three-week lows.
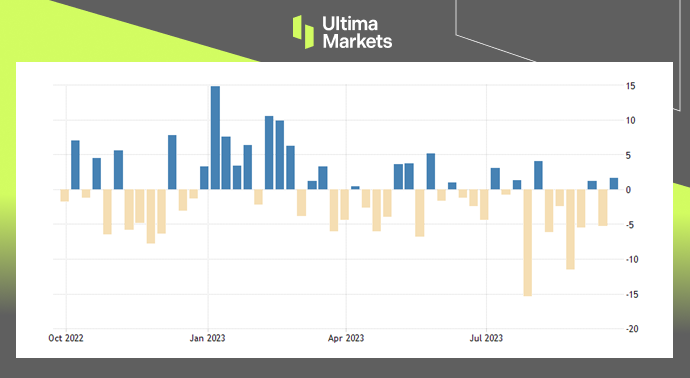
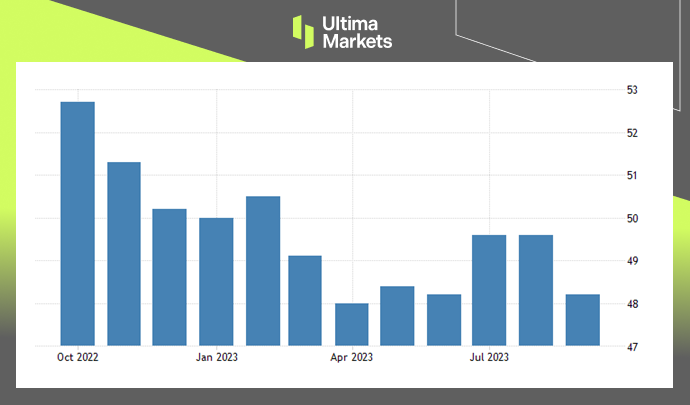
- Increased OPEC Production: Notably, OPEC’s oil production increased by 120,000 barrels per day in September compared to August, reaching 27.73 million barrels per day for the second consecutive month.
- Bearish Sentiment Emerges: Concerns over increased supply and the impact of high interest rates on demand have prompted bearish sentiment in the crude oil market.
Brent Oil Technical Analysis
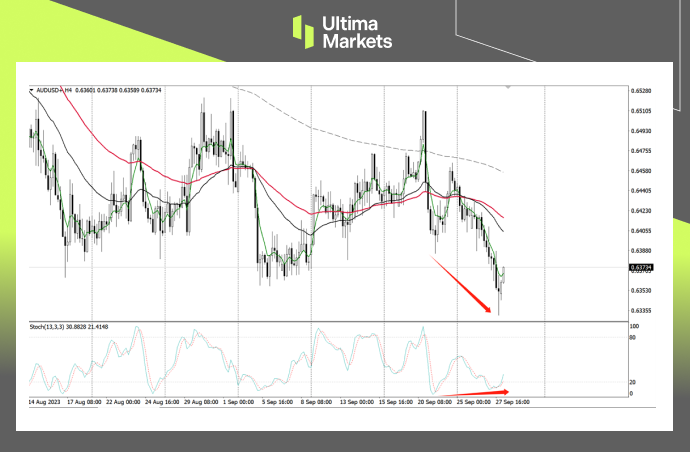
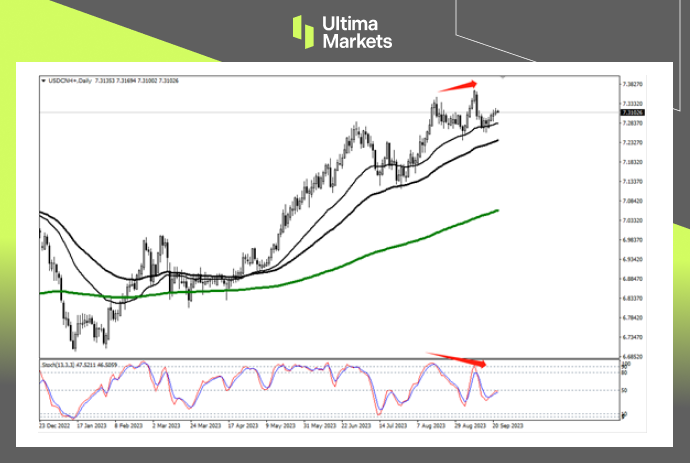
Brent Oil Daily Chart Analysis

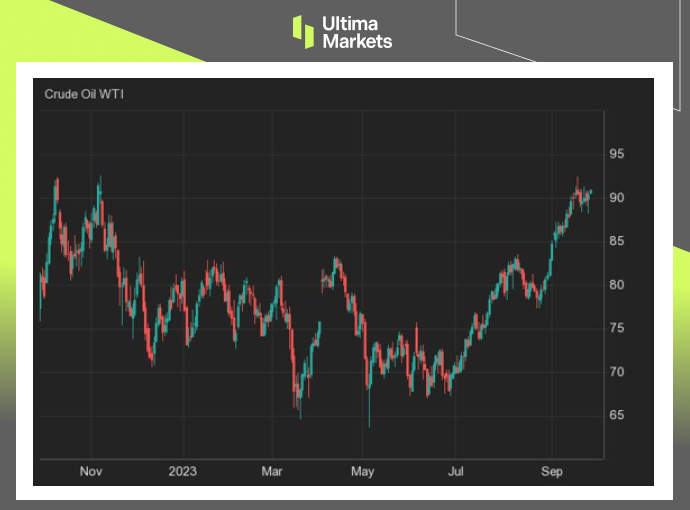
( Daily chart of BRENT OIL, source: Ultima Markets MT4)
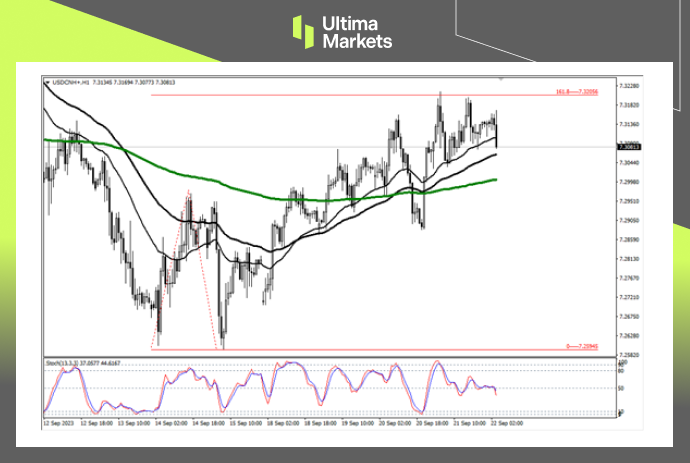
Key Point: The daily chart reveals a rapid decline in crude oil prices, signaling a strong bearish trend.
Stochastic Oscillator Signals
Key Point: Stochastic oscillator technical indicators suggest a divergence from market prices, indicating a high probability of short-term bearishness.
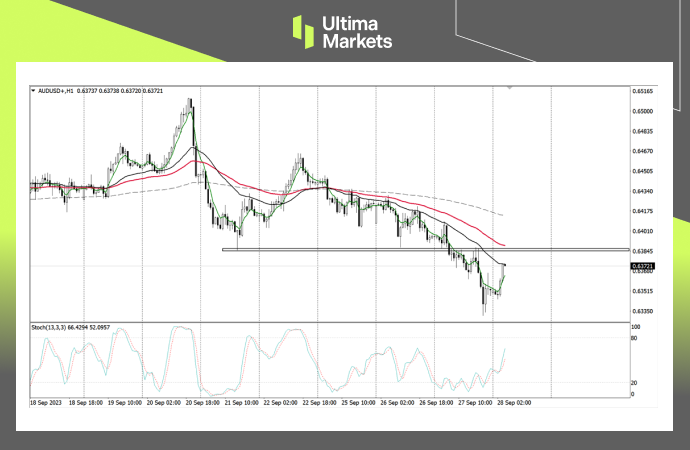
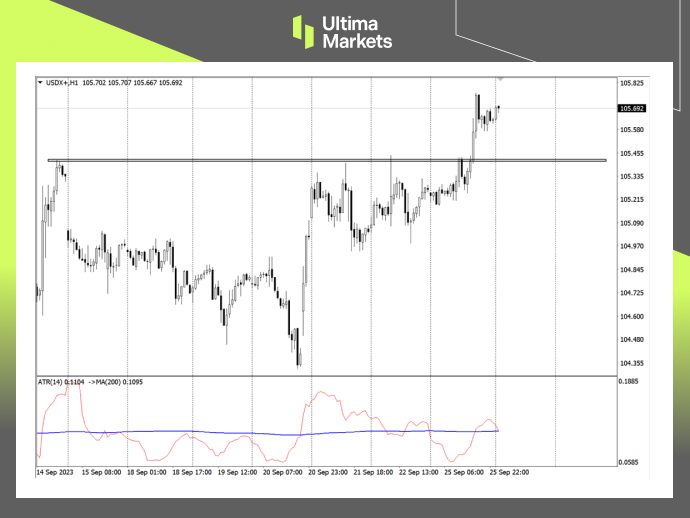
Brent Oil 1 Hour Chart Analysis
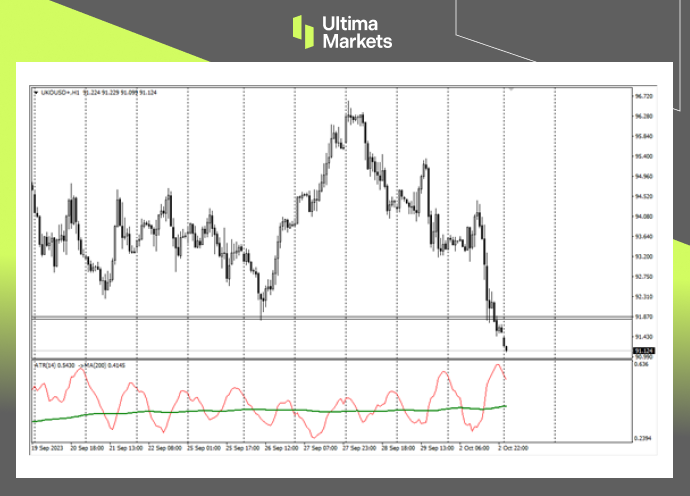
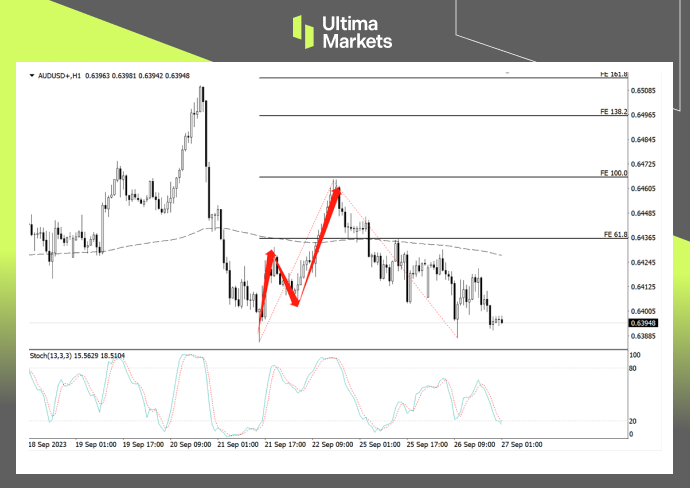
(1hour chart of BRENT OIL, source: Ultima Markets MT4)
Key Point: Recent significant volatility is observed on the 1-hour chart, with the ATR combination indicator signaling an effective breakthrough. Traders should exercise caution and monitor entry opportunities.
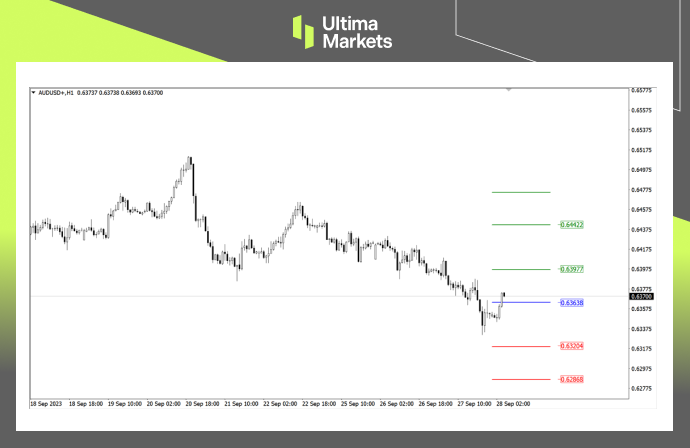
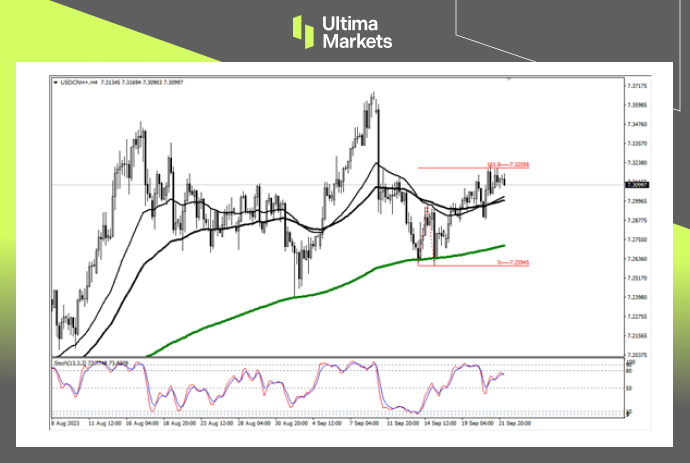
Pivot Indicator

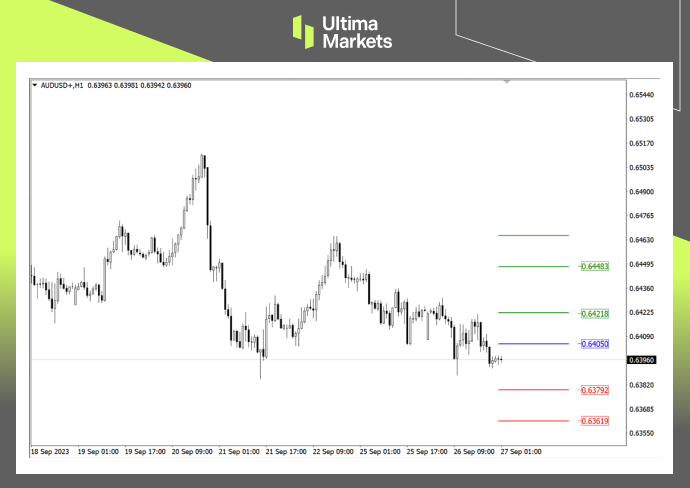
(1-hour chart of BRENT OIL, source: Ultima Markets MT4)
Key Point: According to the pivot indicator in Ultima Markets’ MT4 platform, the central price of the day stands at 92.210. Technical outlook:
- Bullish Scenario: Above 92.210, with targets set at 92.951 and 95.175.
- Bearish Scenario: Below 92.210, with targets at 90.003 and 89.210.
Legal Documents
Ultima Markets, a trading name of Ultima Markets Ltd, is authorized and regulated by the Financial Services Commission “FSC” of Mauritius as an Investment Dealer (Full-Service Dealer, excluding Underwriting) (license No. GB 23201593). The registered office address: 2nd Floor, The Catalyst, 40 Silicon Avenue, Ebene Cybercity, 72201, Mauritius.
Disclaimer
Comments, news, research, analysis, price, and all information contained in the article only serve as general information for readers and do not suggest any advice. Ultima Markets has taken reasonable measures to provide up-to-date information, but cannot guarantee accuracy, and may modify without notice. Ultima Markets will not be responsible for any loss incurred due to the application of the information provided.
Copyright © 2023 Ultima Markets Ltd. All rights reserved.